Home Builder Marketing Mondays : Google Search Trends
October 23, 2017
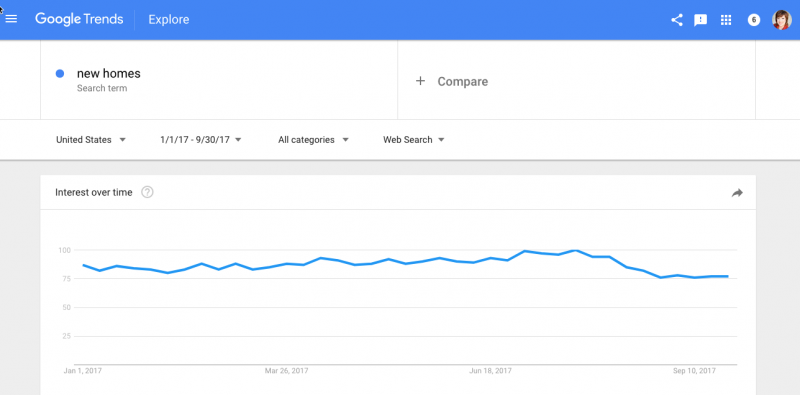
What does this graph mean to you?

In case you aren’t familiar, the Google Trends tool allows you to enter any search query and see the search volume for that term. You can set custom query parameters such as date range, location, and type of search.
We monitor Google Analytics for approximately 30 home builder websites per month. Regardless of company or market size, the web traffic trend line for the majority of them looks exactly like the above graph.
Google search trends are a reliable indicator of consumer confidence and interest in buying new homes. Why the big dip in September? From the end of August thru September, our country experienced four significant adverse events that probably impacted consumer’s confidence. One of those events alone wouldn’t have such a widespread impact, but all combined, we had 45 days straight of horrific, life or death news. My sense is those events impacted consumer’s desire to take a chance on spending money on big ticket items like a home.
Negative trends aren’t an excuse for lack of leads and sales. We have to make our numbers. We have to get out there and scrap for traffic, leads, and sales with the buyers we do have. But, it is an indication that your numbers either are or are not on trend with a bigger picture. And that can be both reassuring and frustrating all at the same time.
What do you see out there? What does your Google Analytics website traffic trend line look like from Jan 1, 2017 – Sept. 30, 2017? Would love to get more input beyond what we are seeing.
Next week I’ll talk about the three things our clients are doing to buck and boost their trend line above average.
Related Posts:
Categorised in: Home Builder Marketing & Sales, Marketing Mondays


